Visualizing Racial Segregation Post-Apartheid
Cape Town, South Africa
By Callan Hajosy
segregation, apartheid, social justice
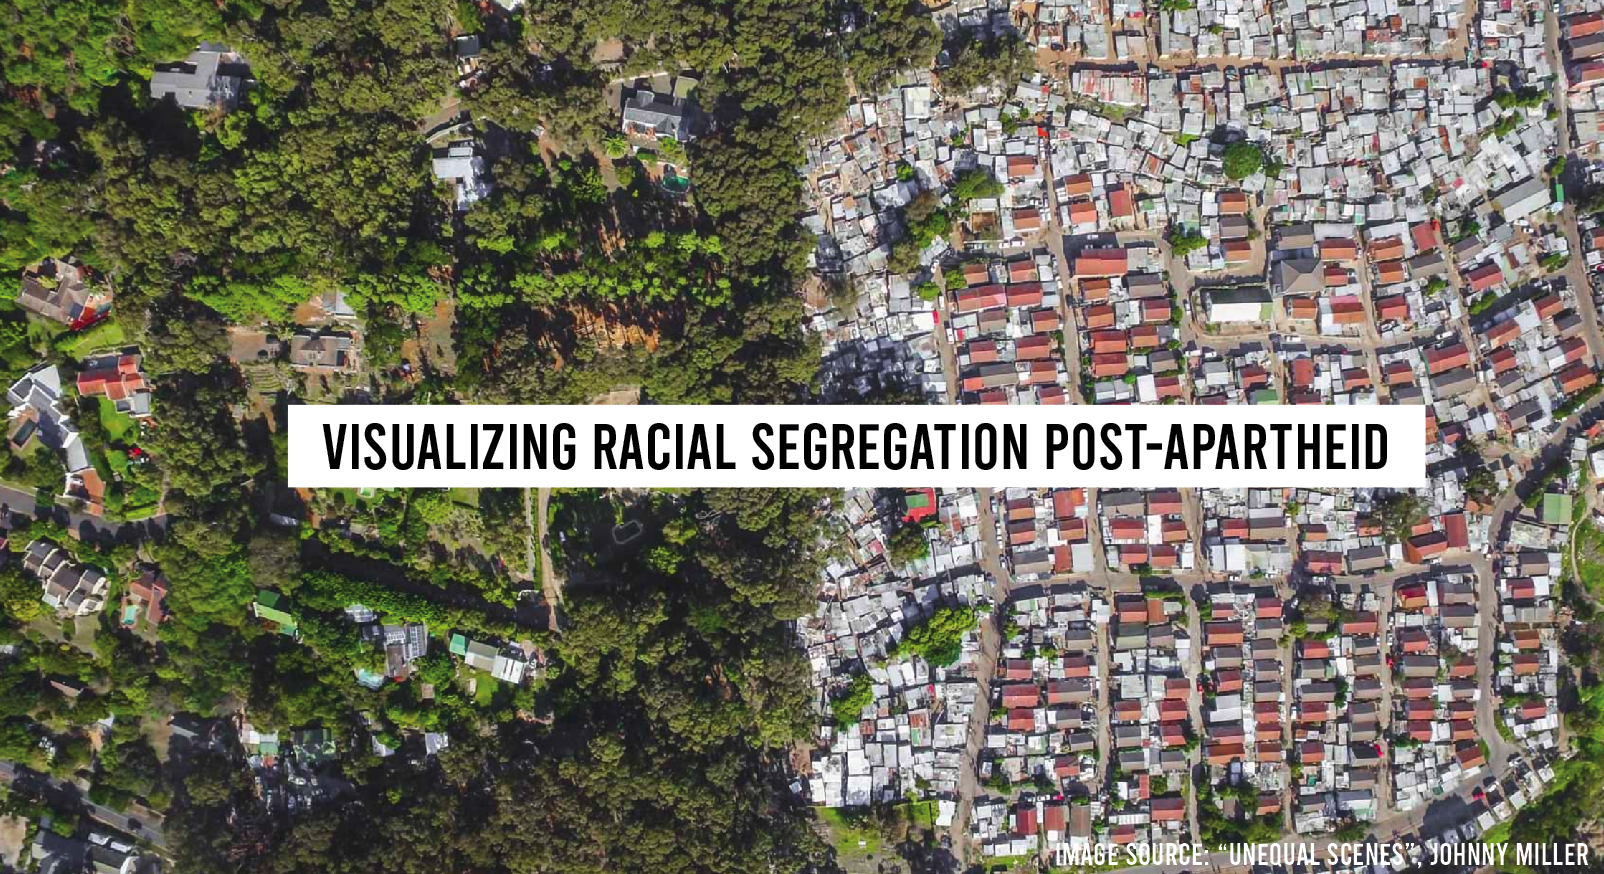
Visualizing how racial segregation has persisted post-apartheid in Cape Town, South Africa.
The aim of this project was to compare census data over time to visualize how racial segregation has persisted post-apartheid in Cape Town. Like many places, South Africa experienced violent colonization that fueled policies of racial segregation and discrimination based on race. Throughout the 1900s during the apartheid regime, Cape Town City Council and the government continued to pass legislation that promoted “whites only” areas and pushed classified African, Coloured and Indian people out of the city and central business district. Among others, two key pieces of legislation passed in 1950 played a pivotal role in enforcing residential racial segregation in Cape Town and elsewhere in South Africa. The first was the Population Registration Act of 1950 which classified people according to government-defined and allocated racial categories (White, Indian, Black African, Coloured). This Act provided for the issuing of identity cards indicating the assigned racial group of the cardholder. The second Act, the Group Areas Act, gave the government power to demarcate where each racial group could live and own property. This act launched a series of forced removals of non-white residents into the urban fringes in what are known as “townships”. The legacy of apartheid and forced removals left Cape Town a racially segregated city, which has given way to economic segregation; residential suburbs created by apartheid through forced removals are still visible, and although there has been some amount of integration, reversing entrenched inequality will require innovative solutions.
 (Image Source: David Kay)
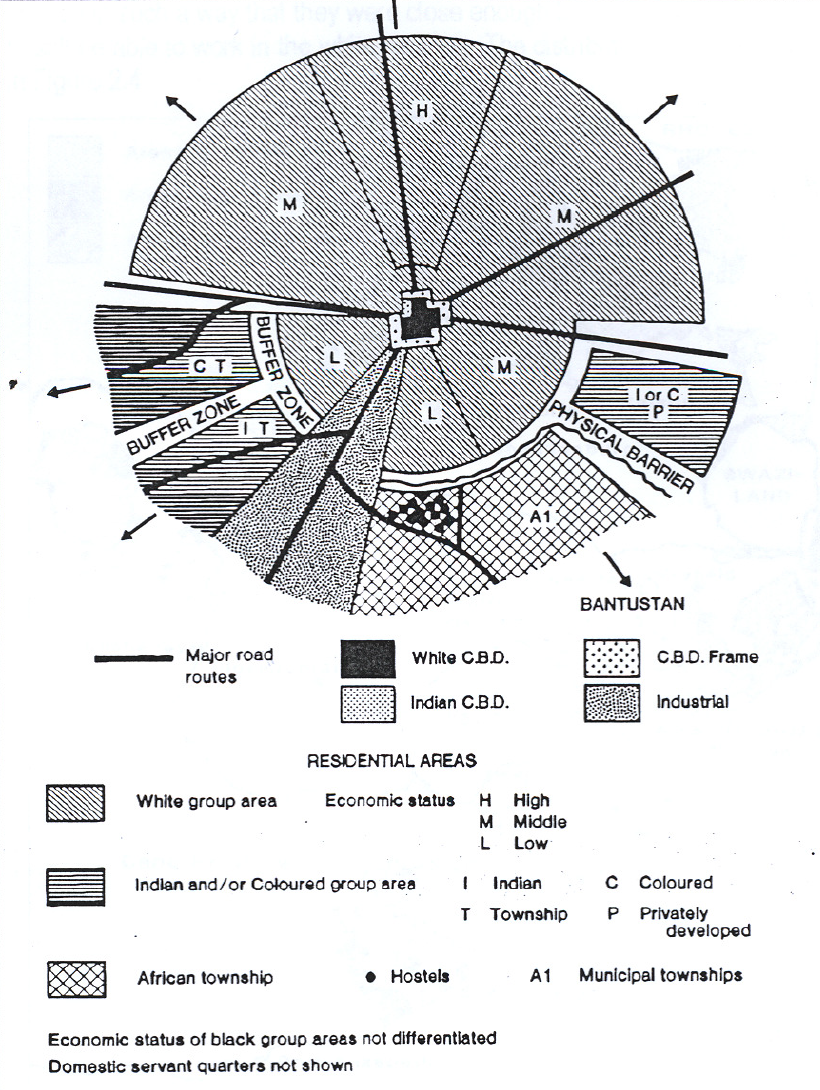
The image above shows the “architecture” of apartheid spatial planning, where specific areas are marked by racial category with buffer zones and major road infrastructure used as physical barriers.
 (image source: Myriam Houssay-Holzschuch, Olivier Ninot, and Emma Thébault)
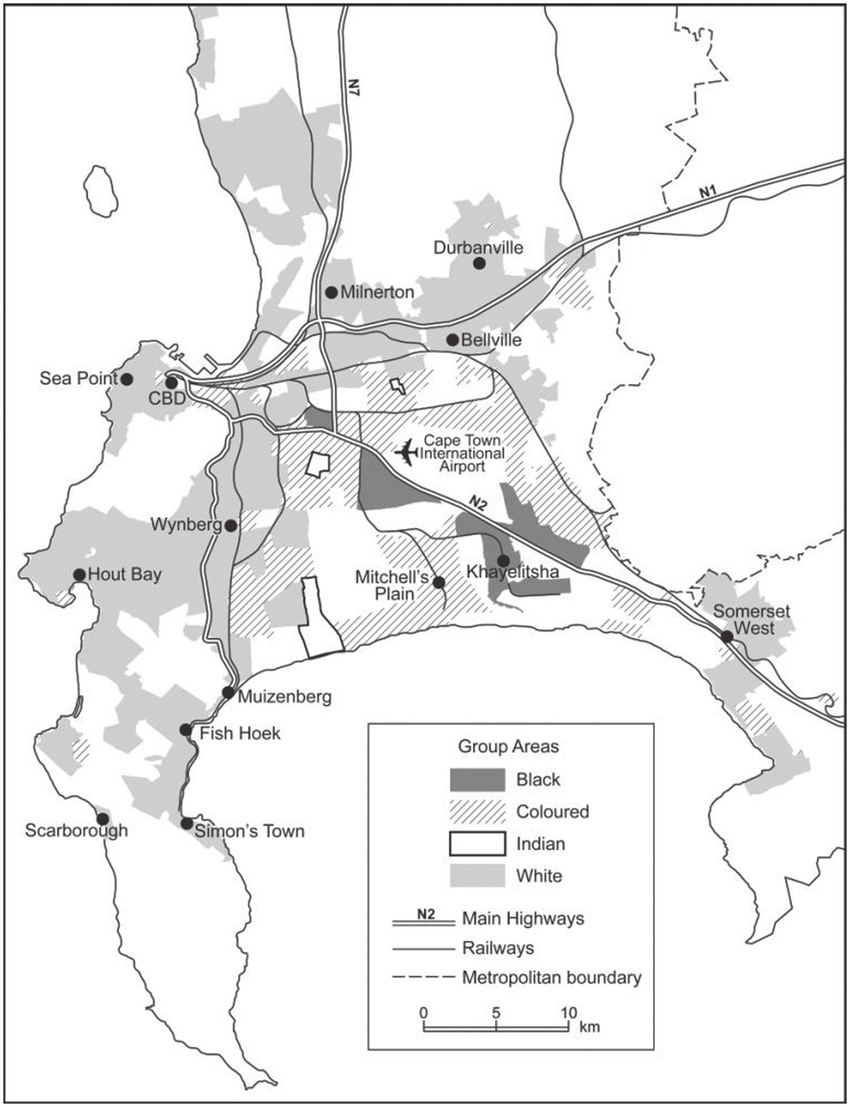
The image above shows Cape Town under the Group Areas Act, which explicitly regulated land use based on racial classification.
Through this project, my aim was to use census data to visualize the racial segregation by looking at population density by racial classification and how it has (or has not) changed post-apartheid, from 1996-2001. This is ultimately a starting point for a more in-depth analysis of persistent racial and economic segregation that has resulted from the legacy of apartheid.
South Africa has conducted a number of comprehensive census surveys as a democratic nation after the end of apartheid, the first of which was in 1996, followed by 2001 and 2001. The government decided not to conduct a census in 2006, and the next one will be conducted in 2021.
After apartheid ended, there was recognition by the new democratic government of the urgent need for housing.
At the start, I struggled to find geographical data that could be used in QGIS (many attempts to access data resulted in dead-ends and will take more time than available for the scope of this project to pursue further). My primary source of census data was taken from a project by Brown University:
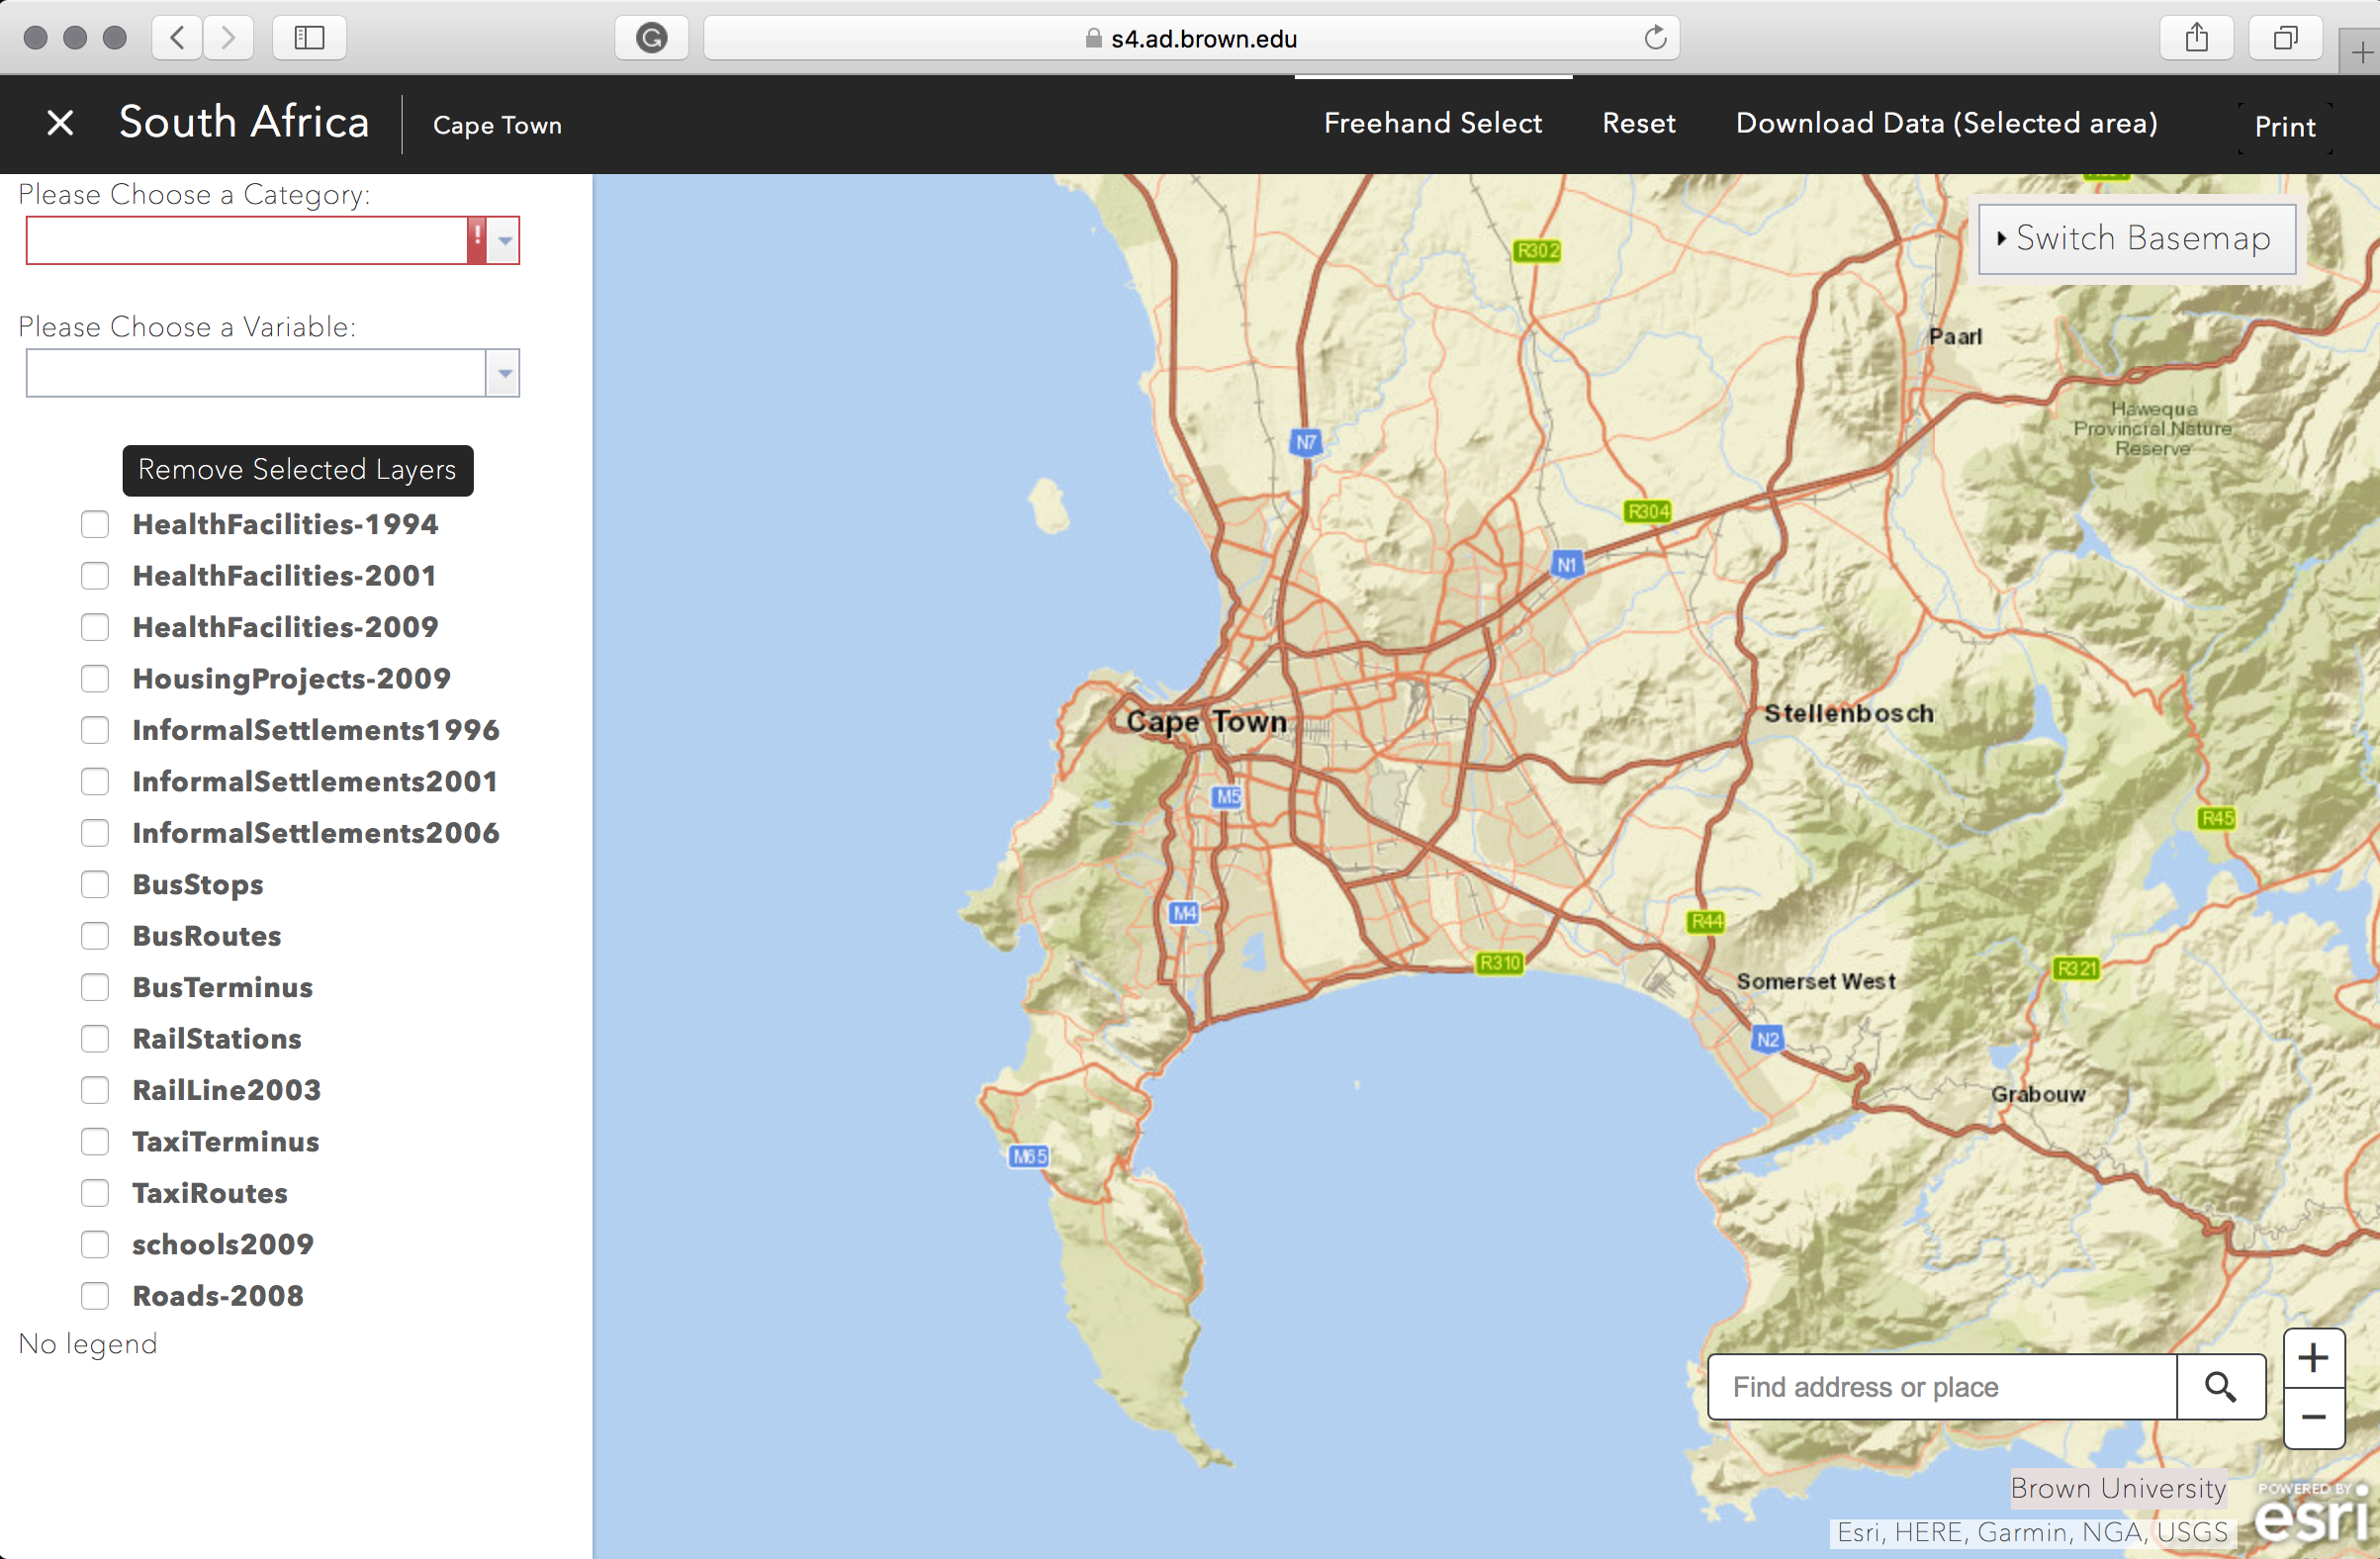
To use the data that they layered on the map, I ran a query on this site in order to convert the data of a specific area into a GeoJSON file.
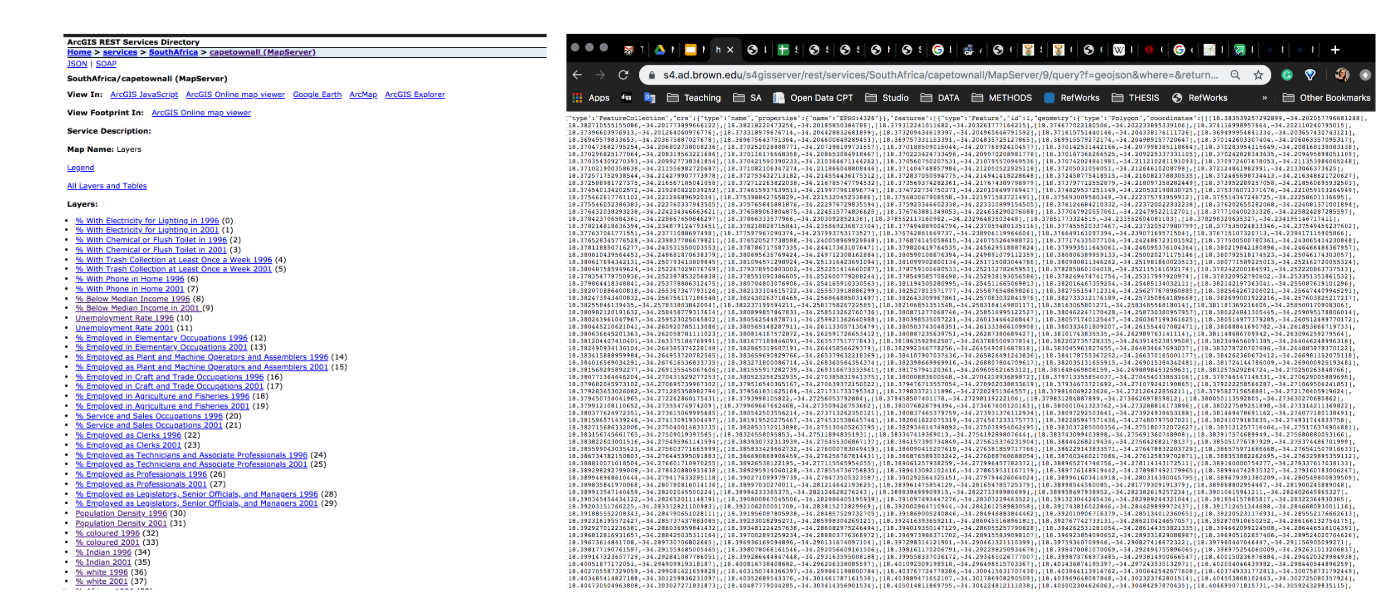
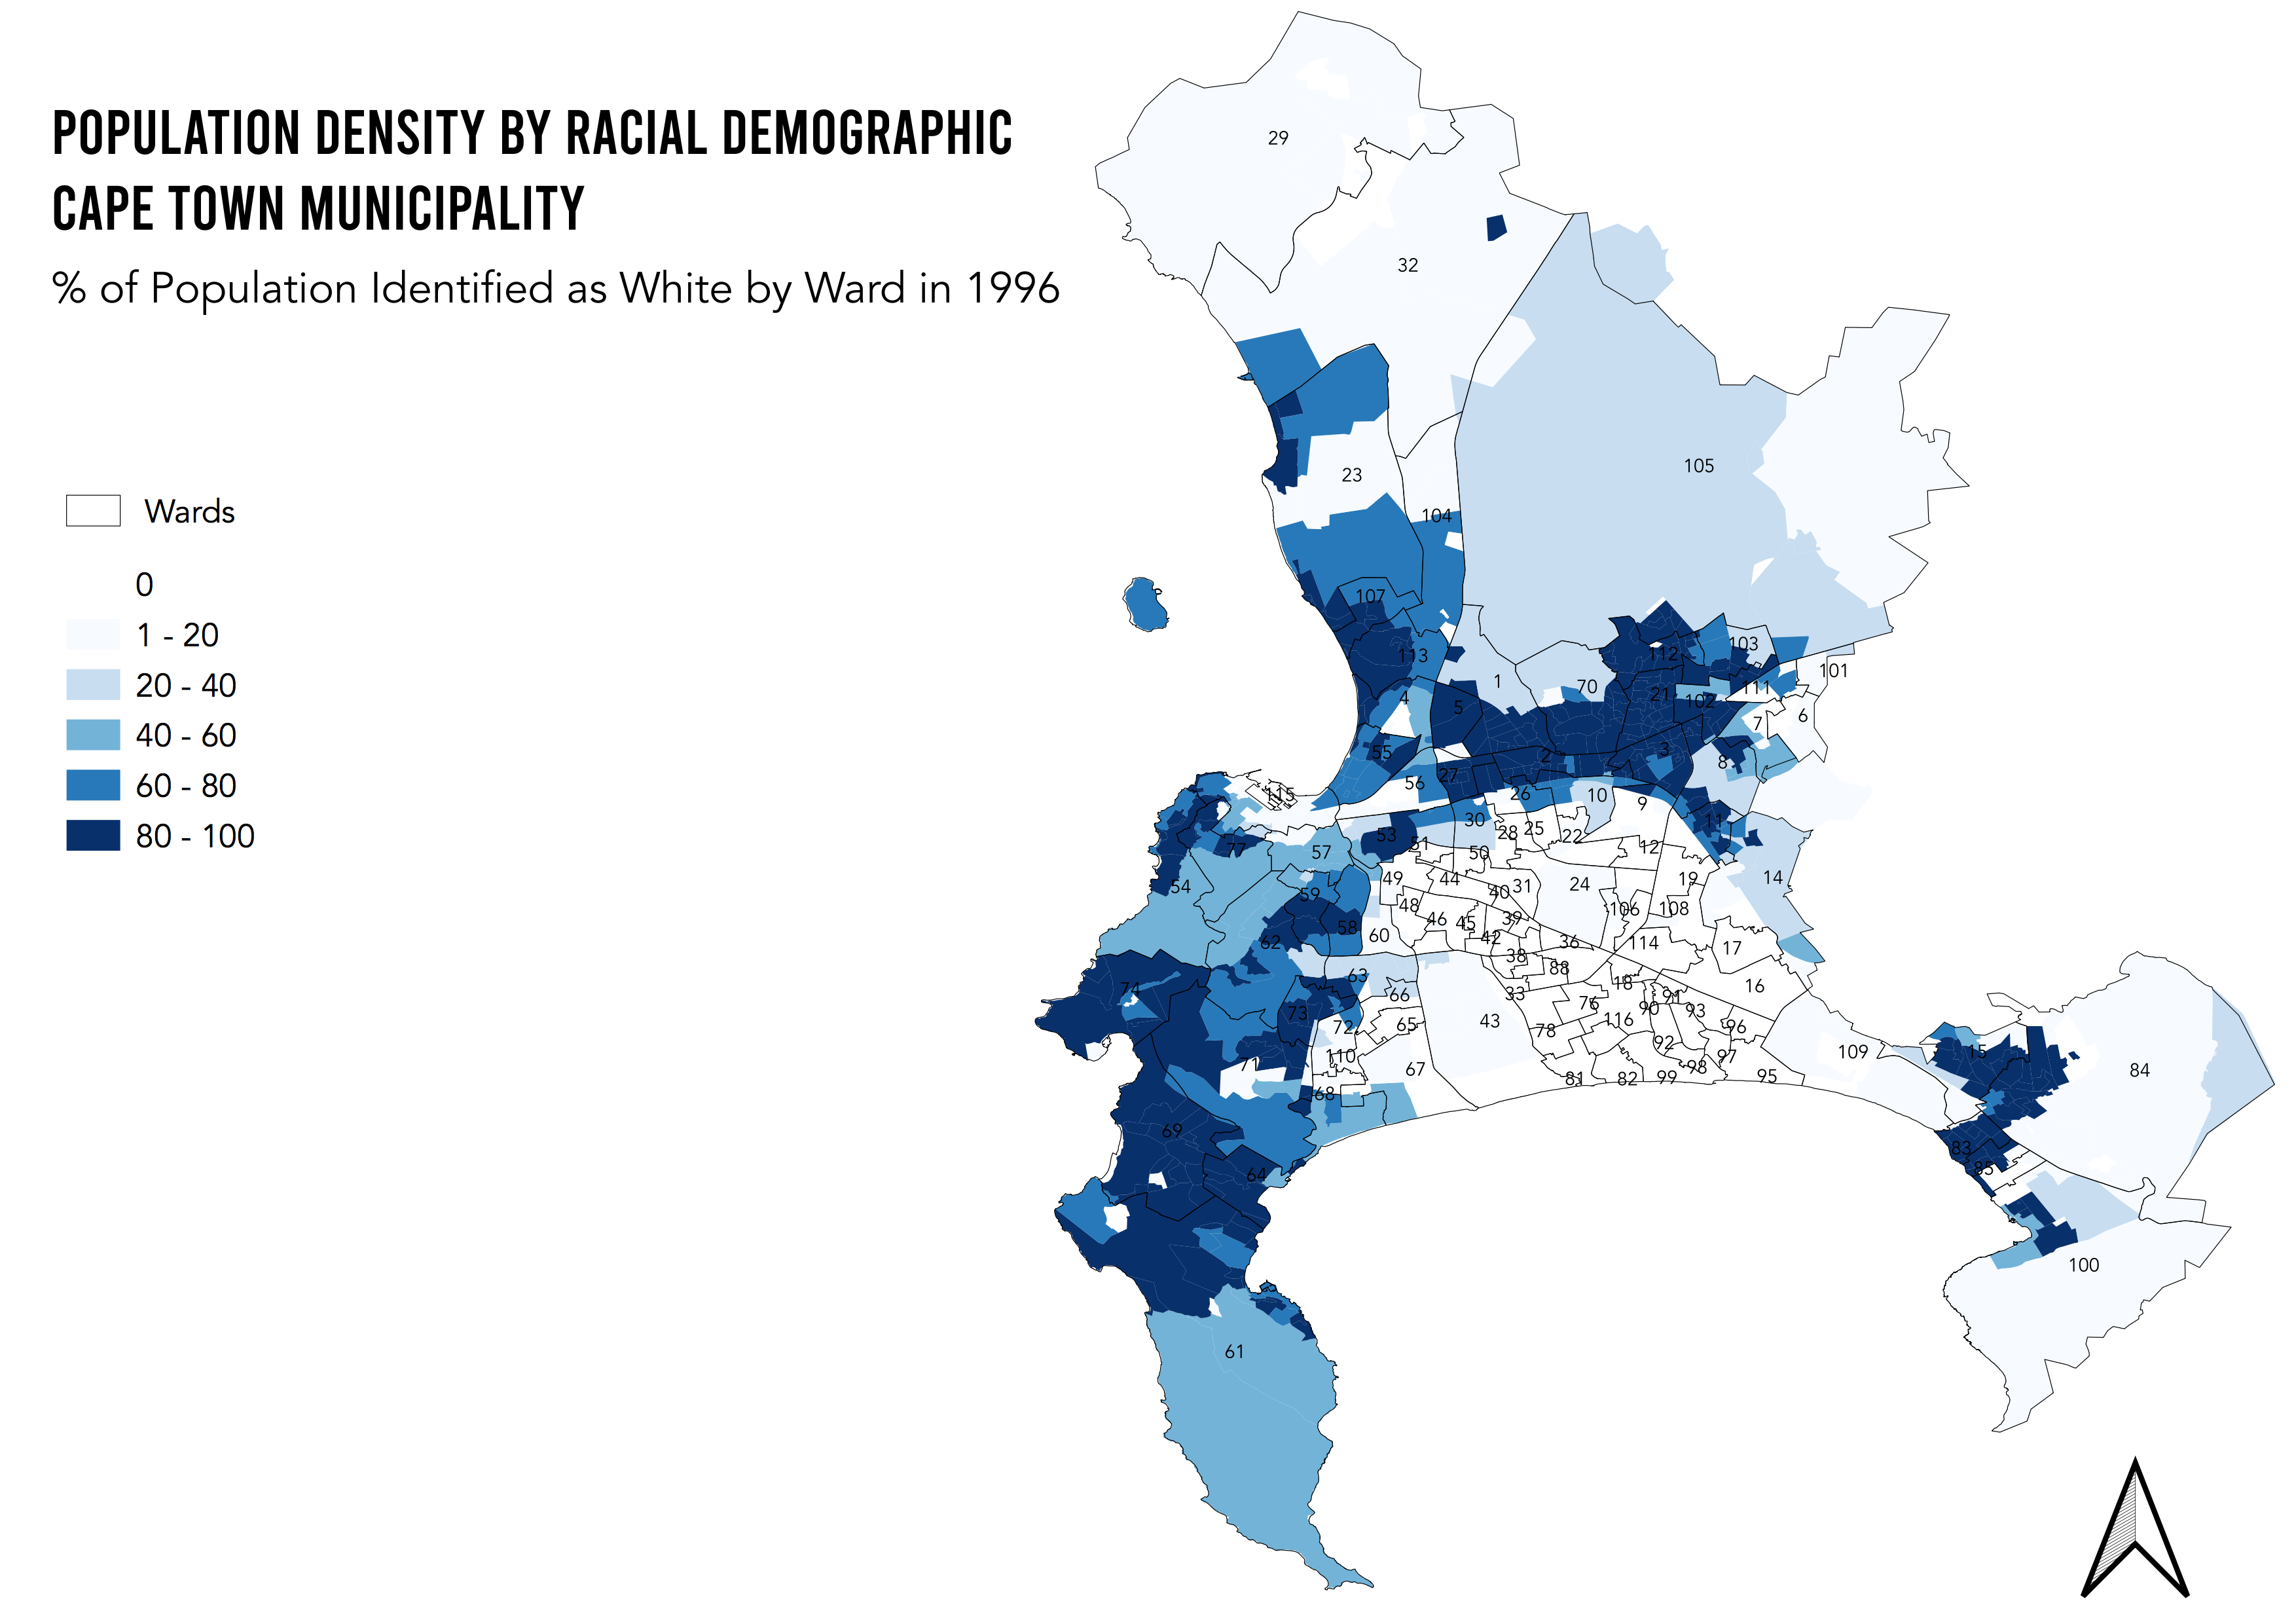
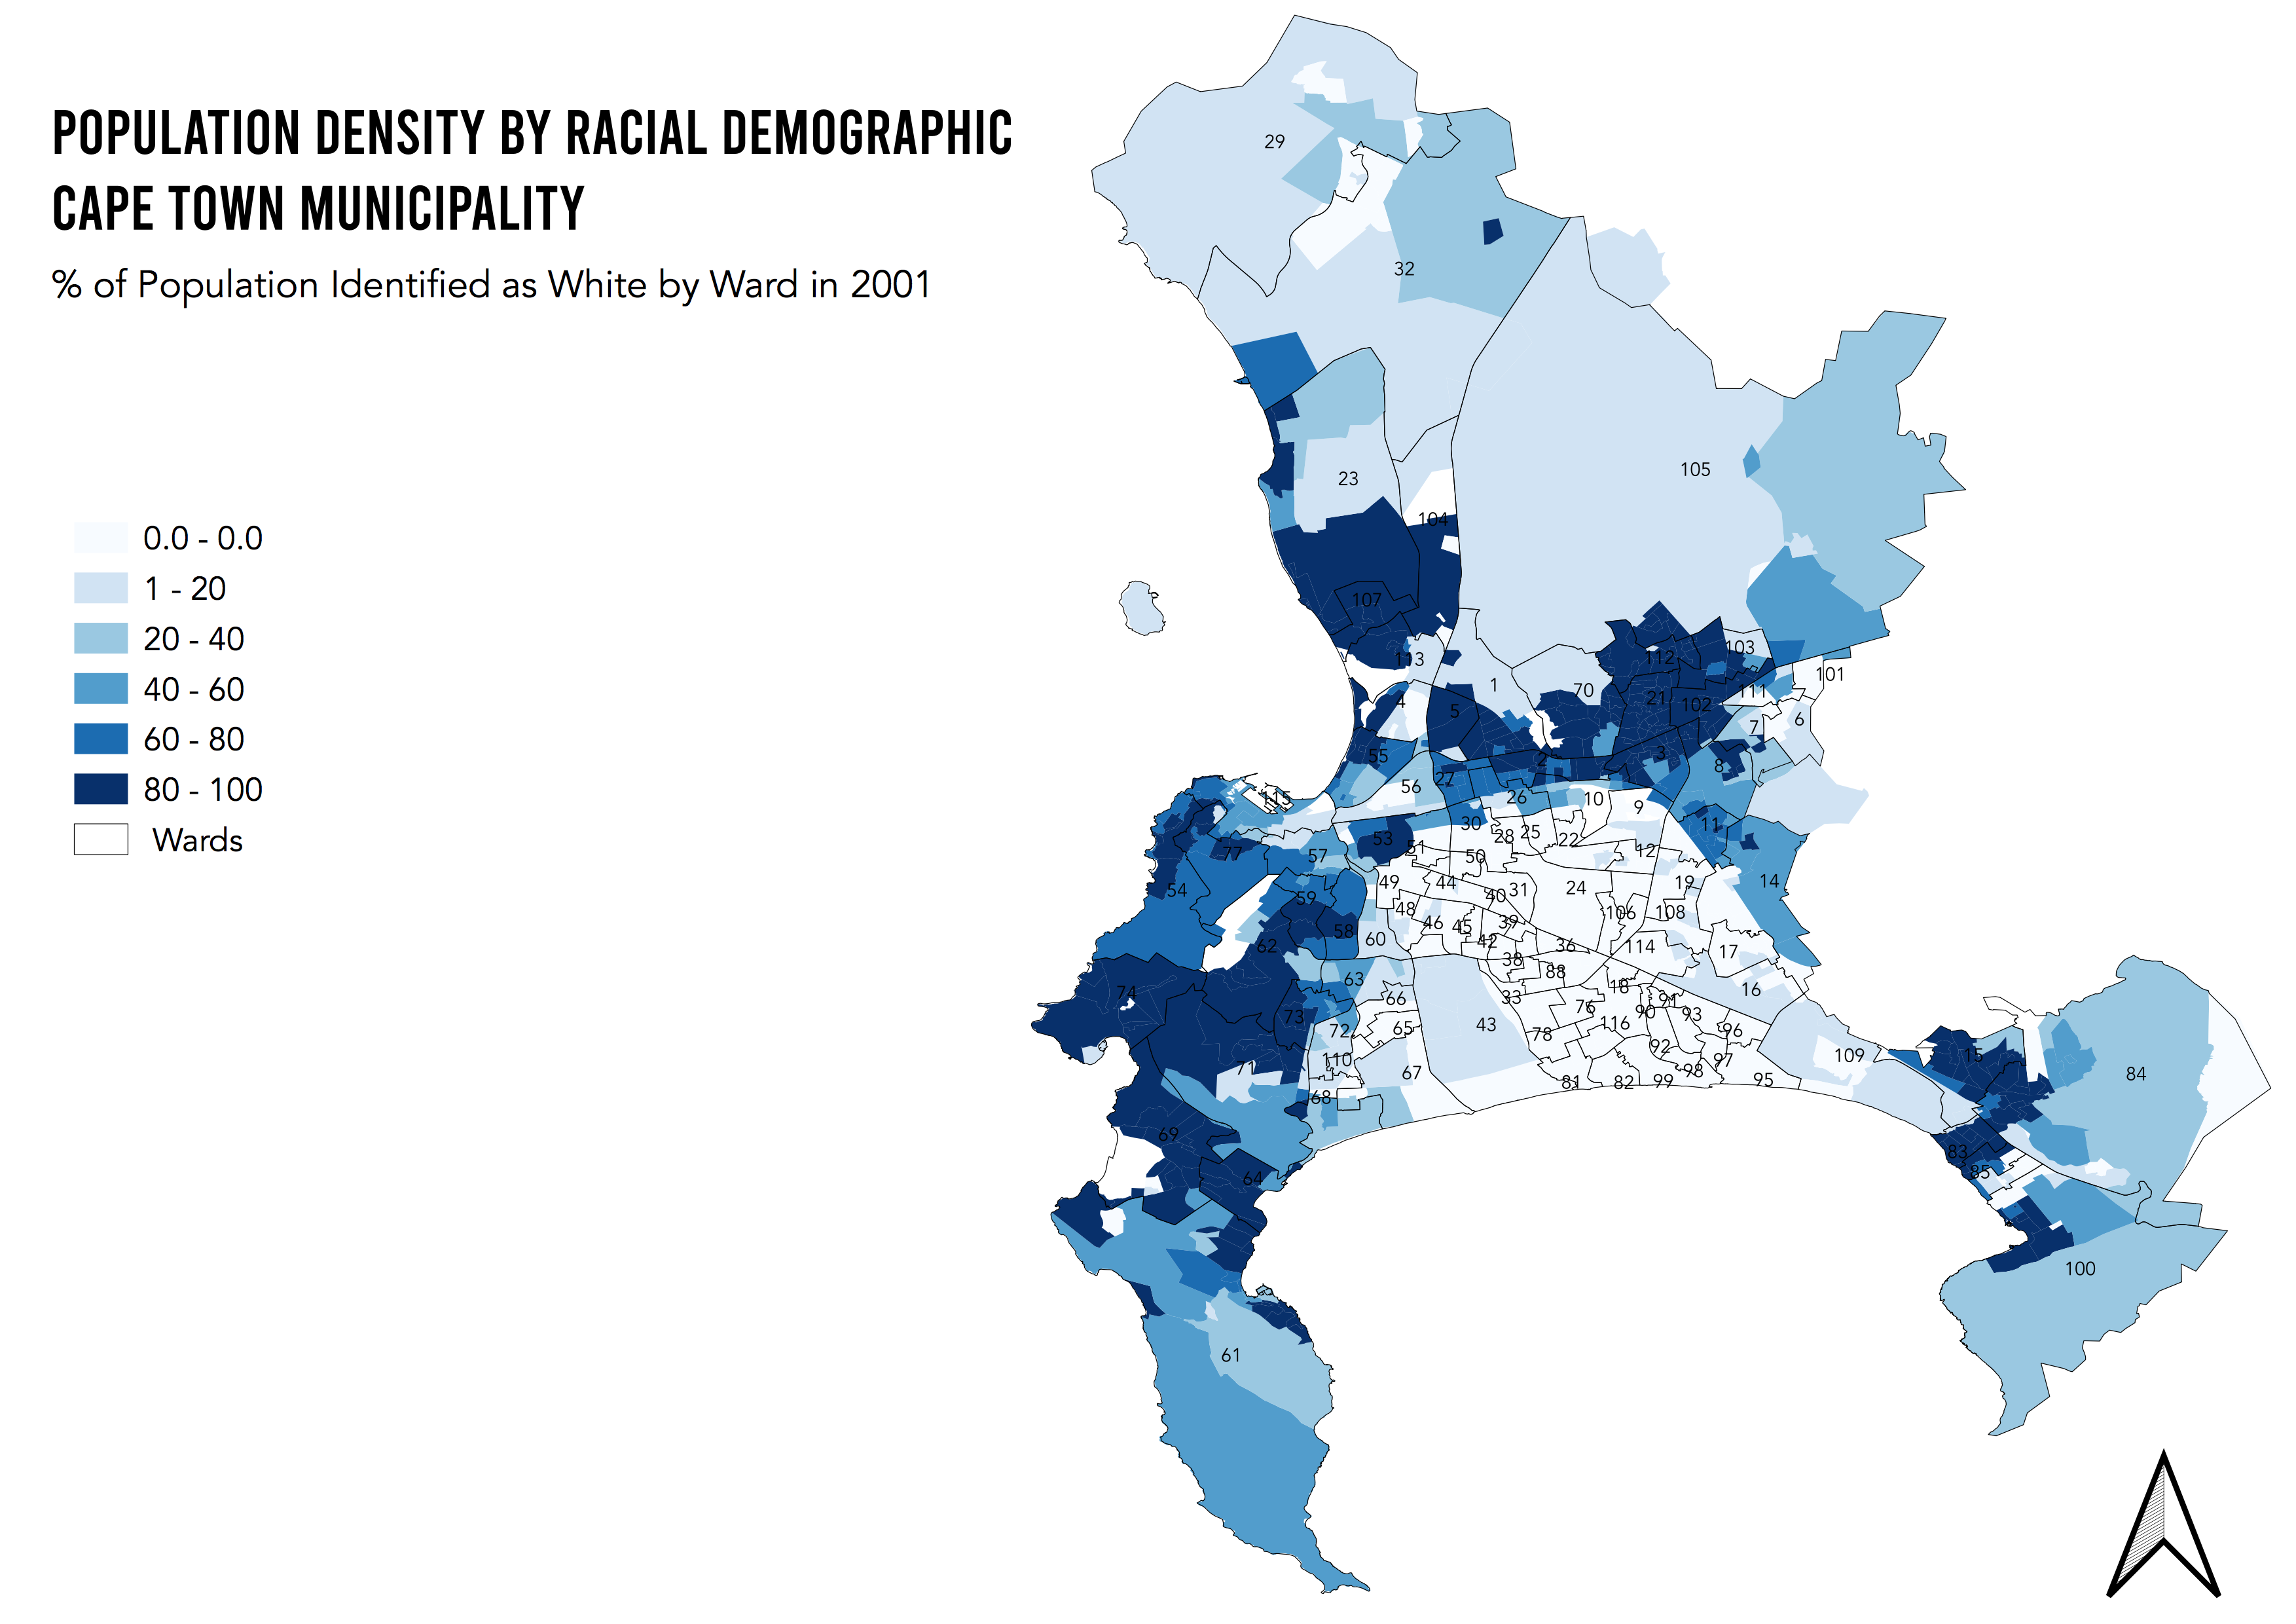
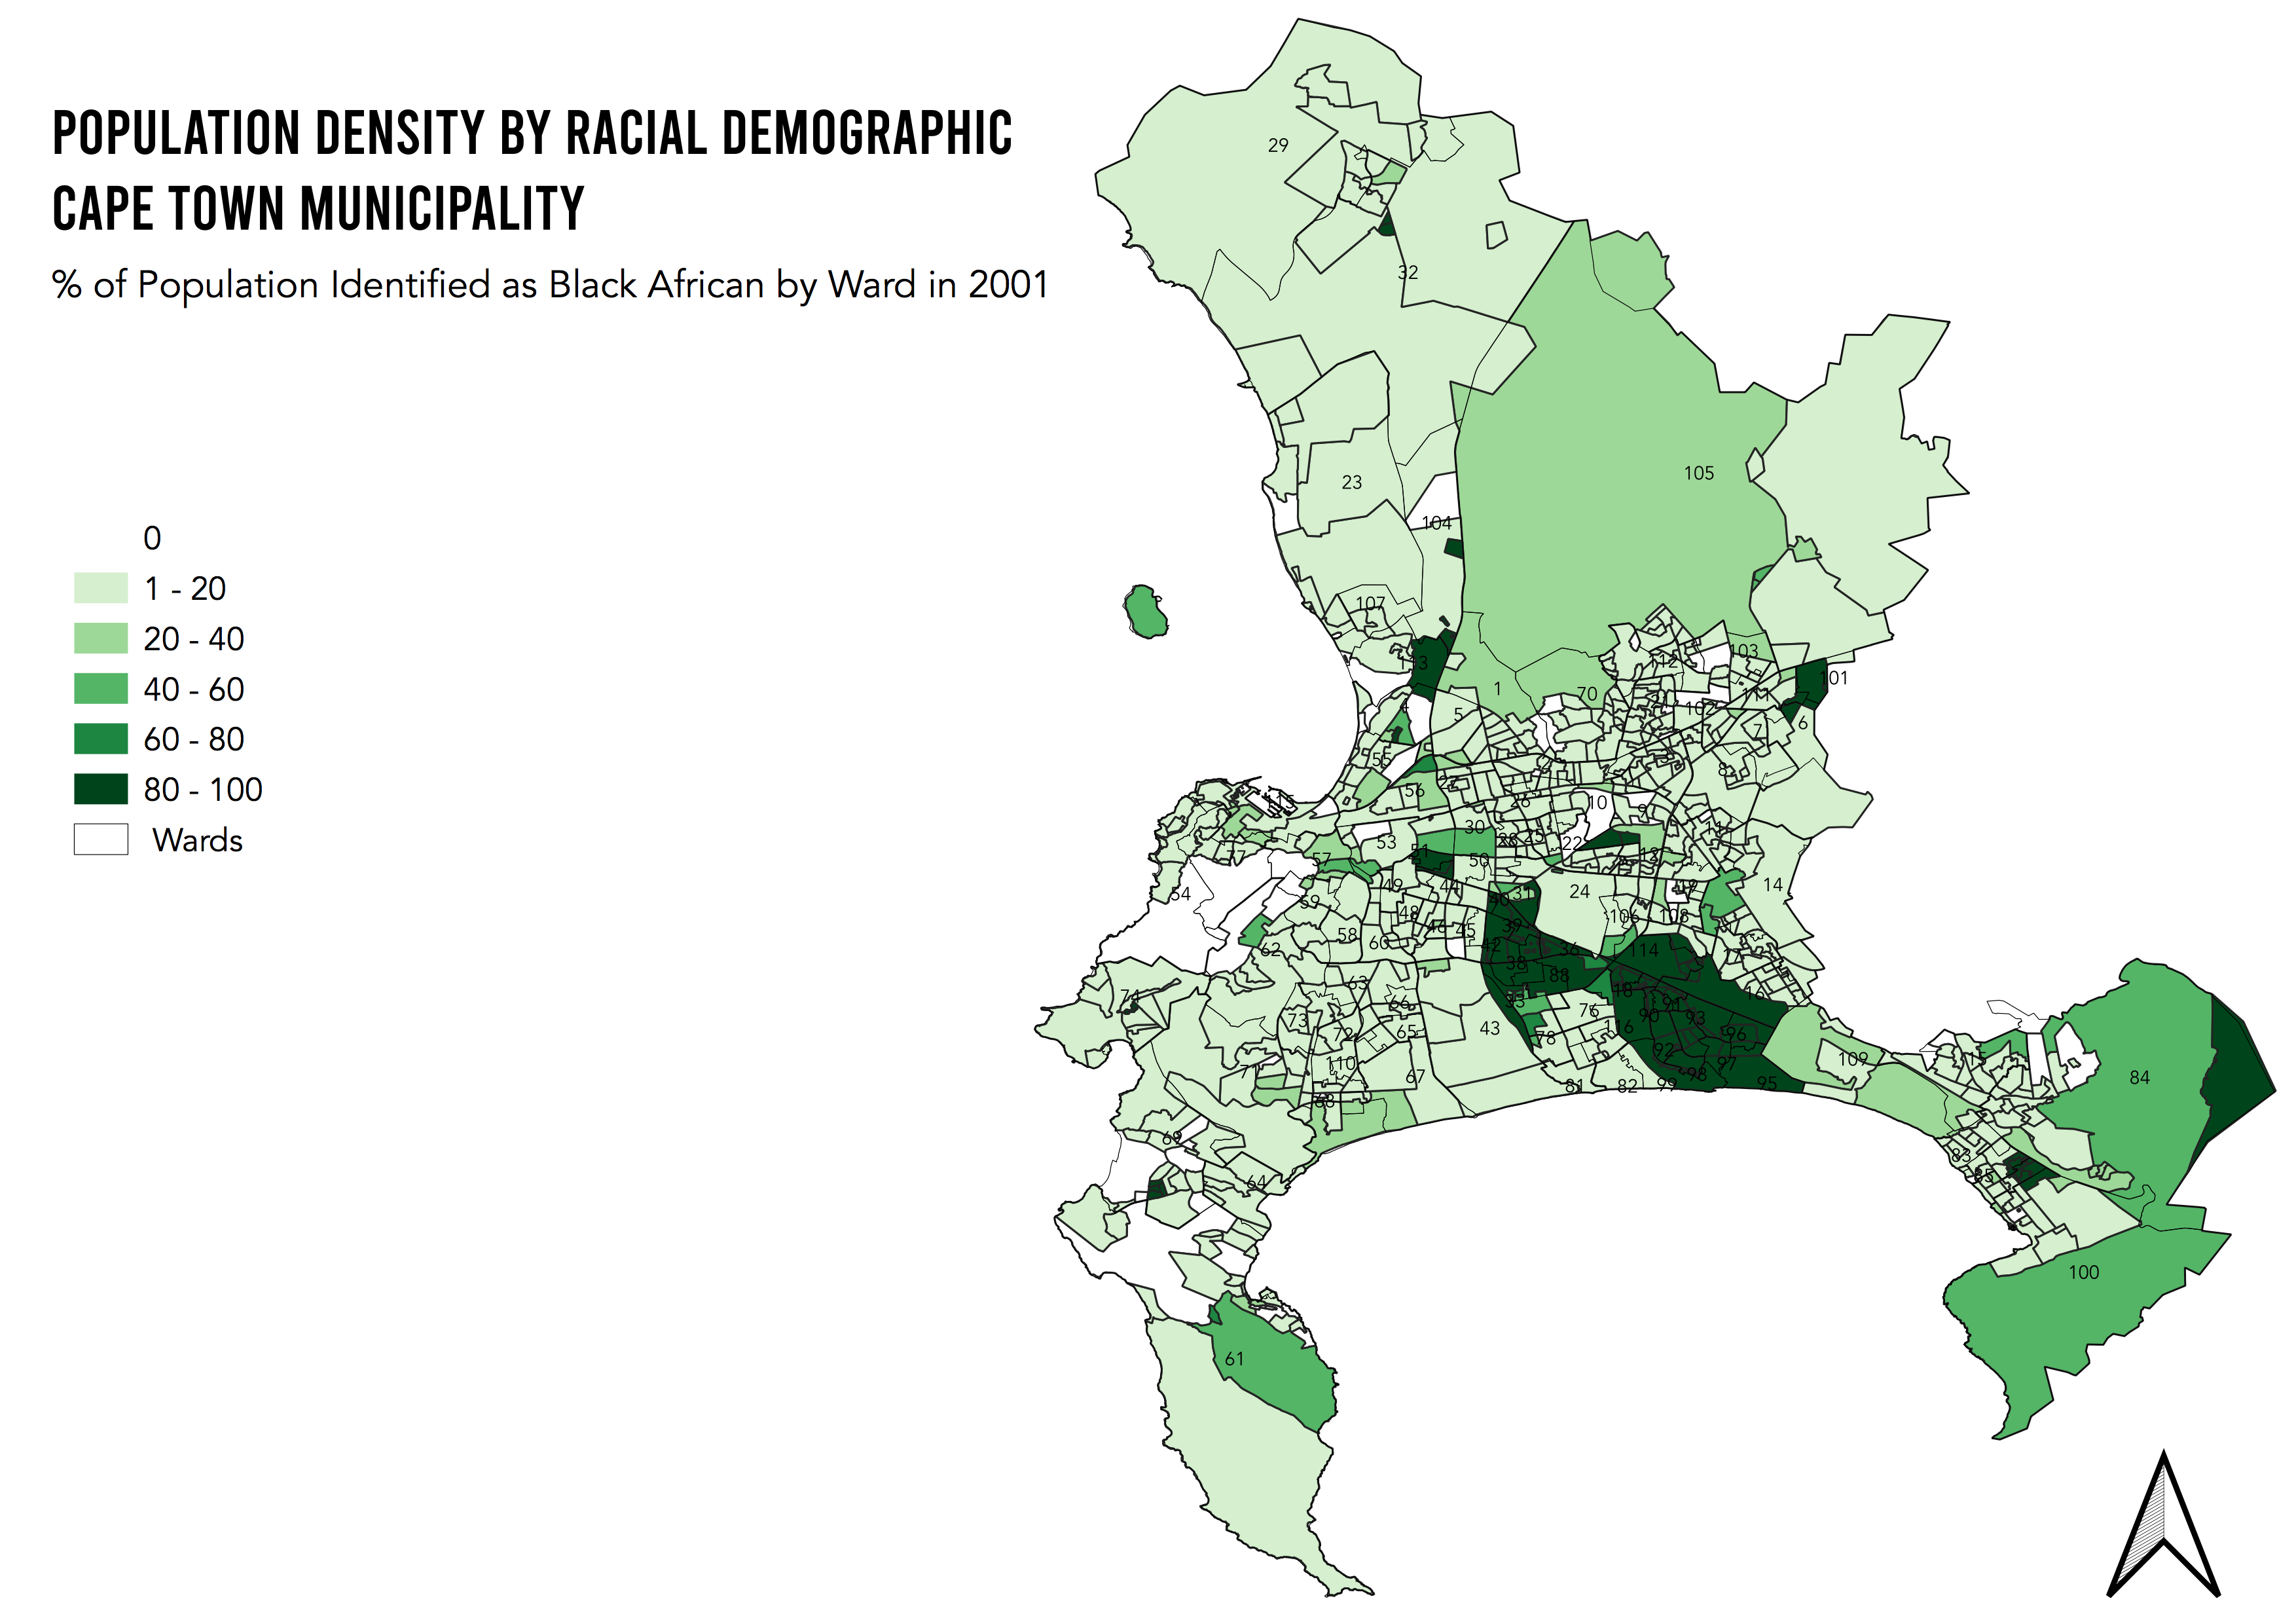
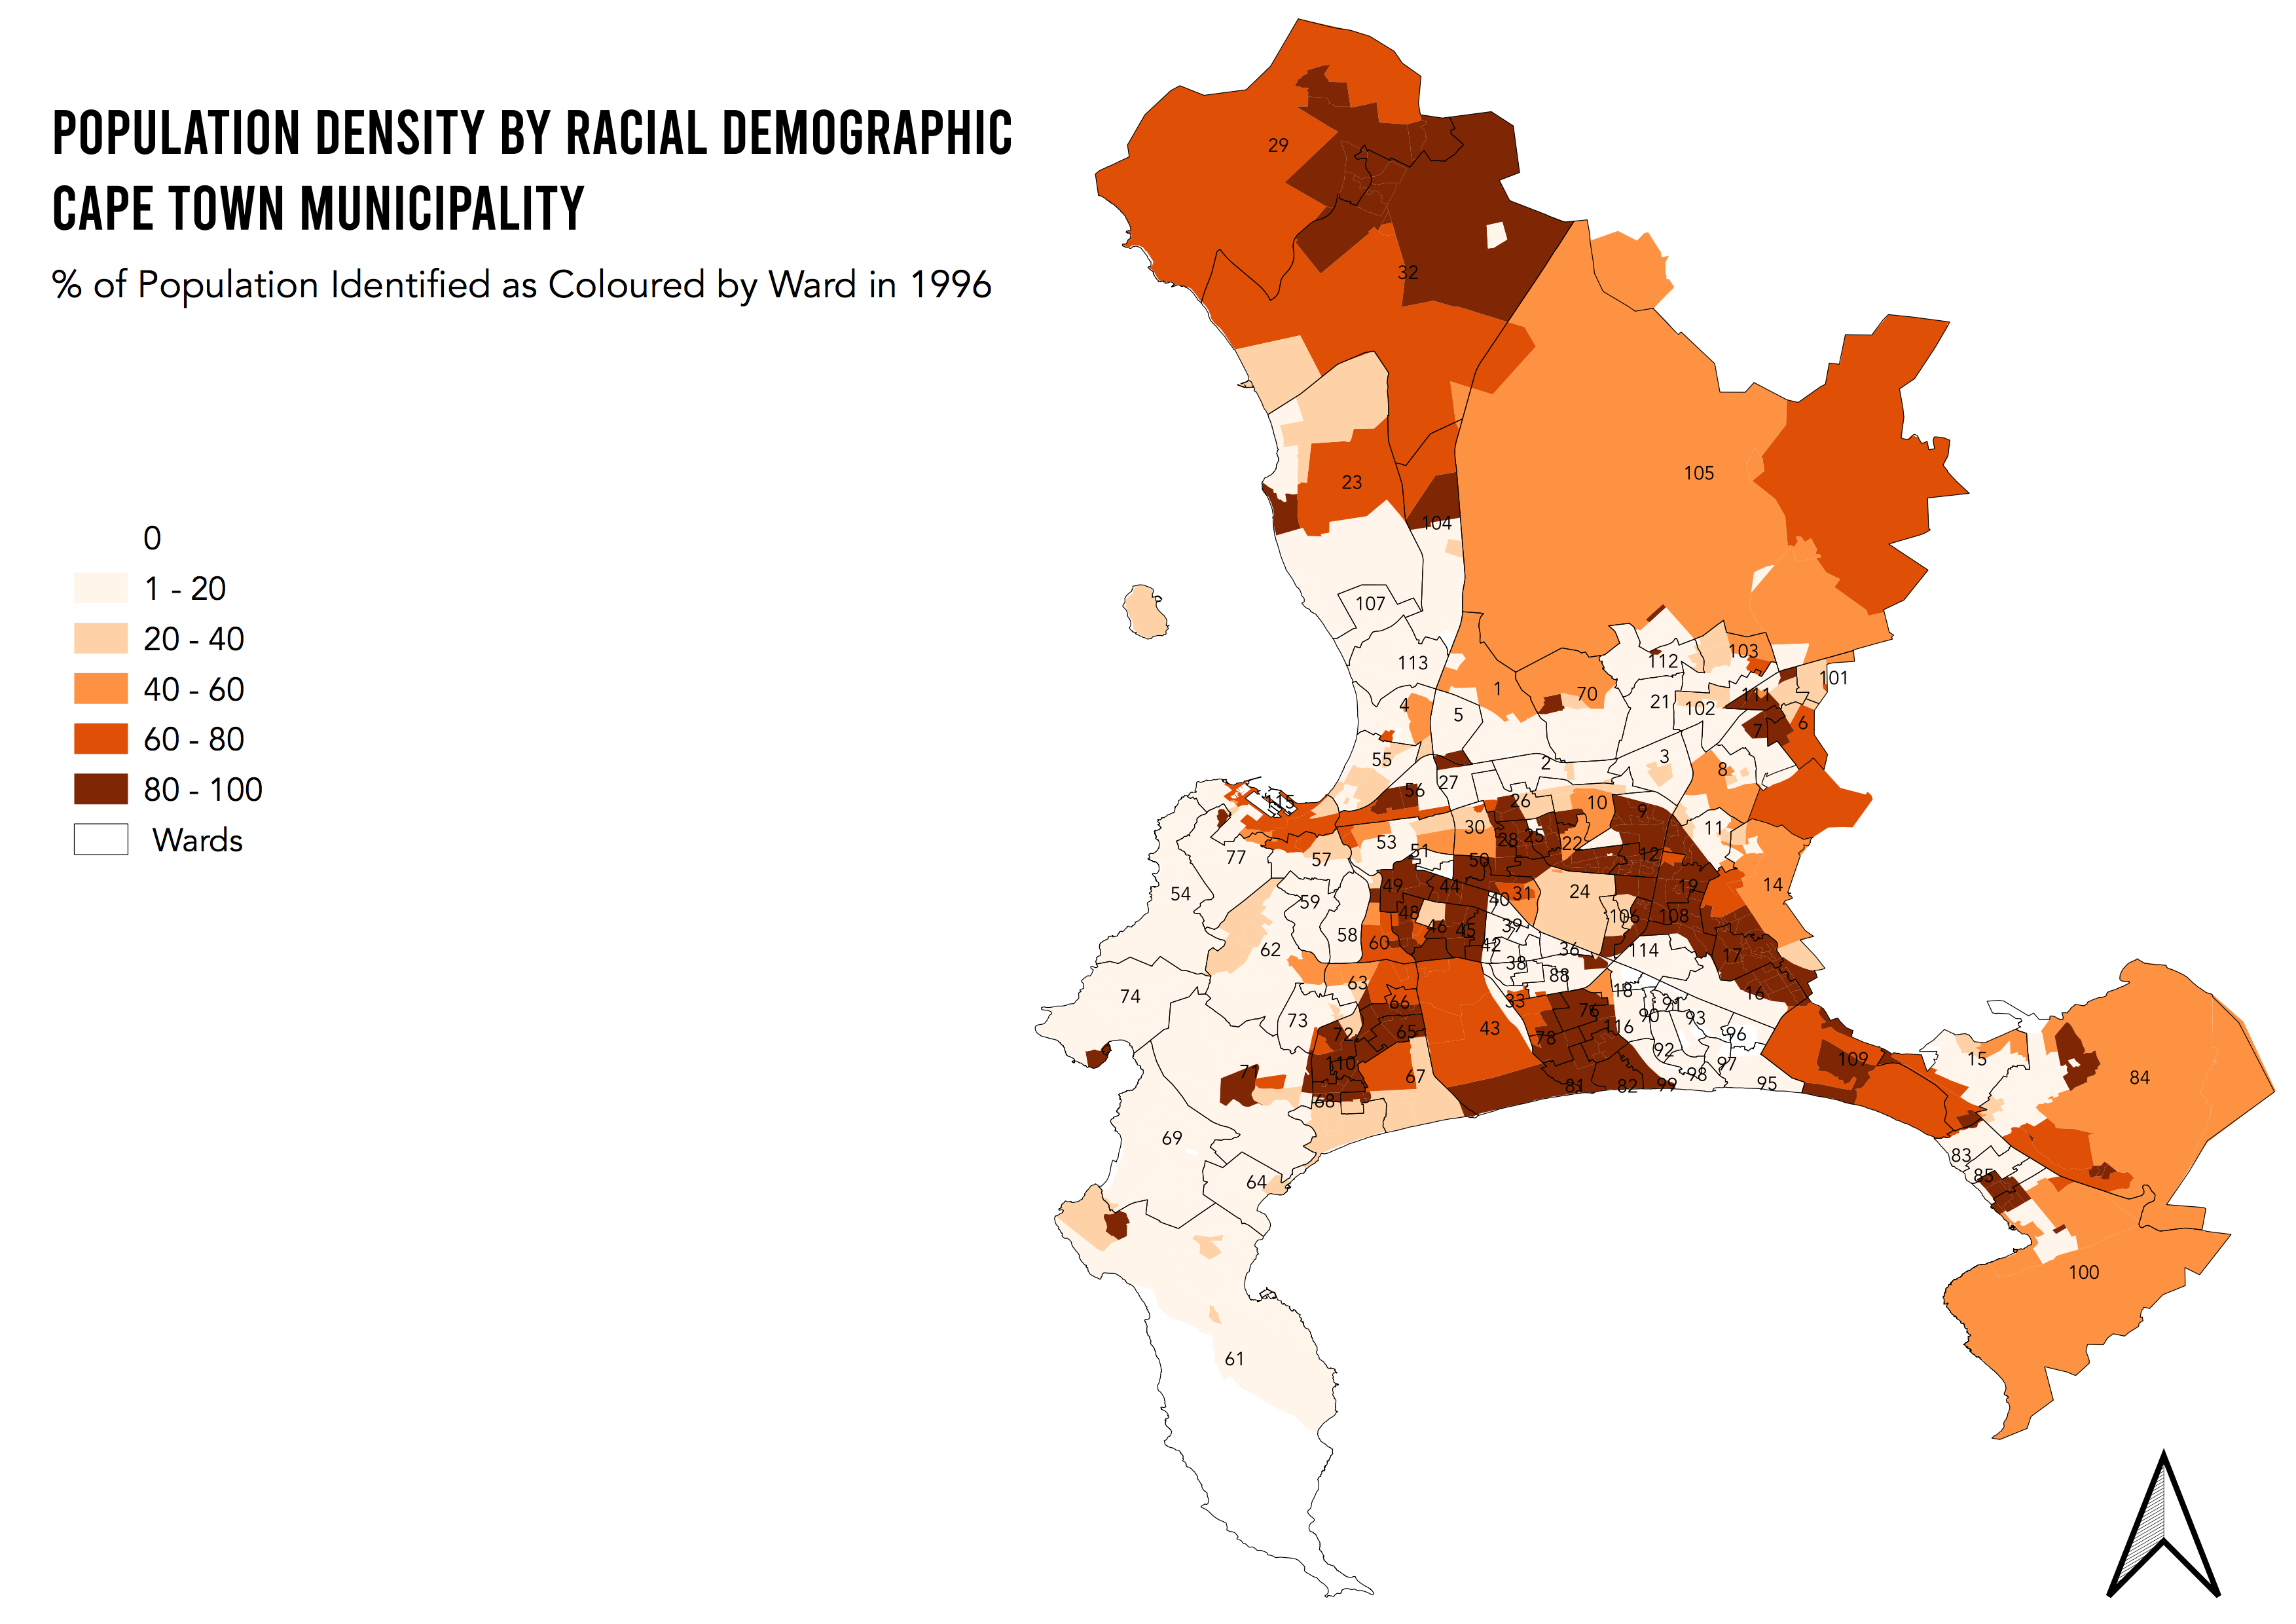
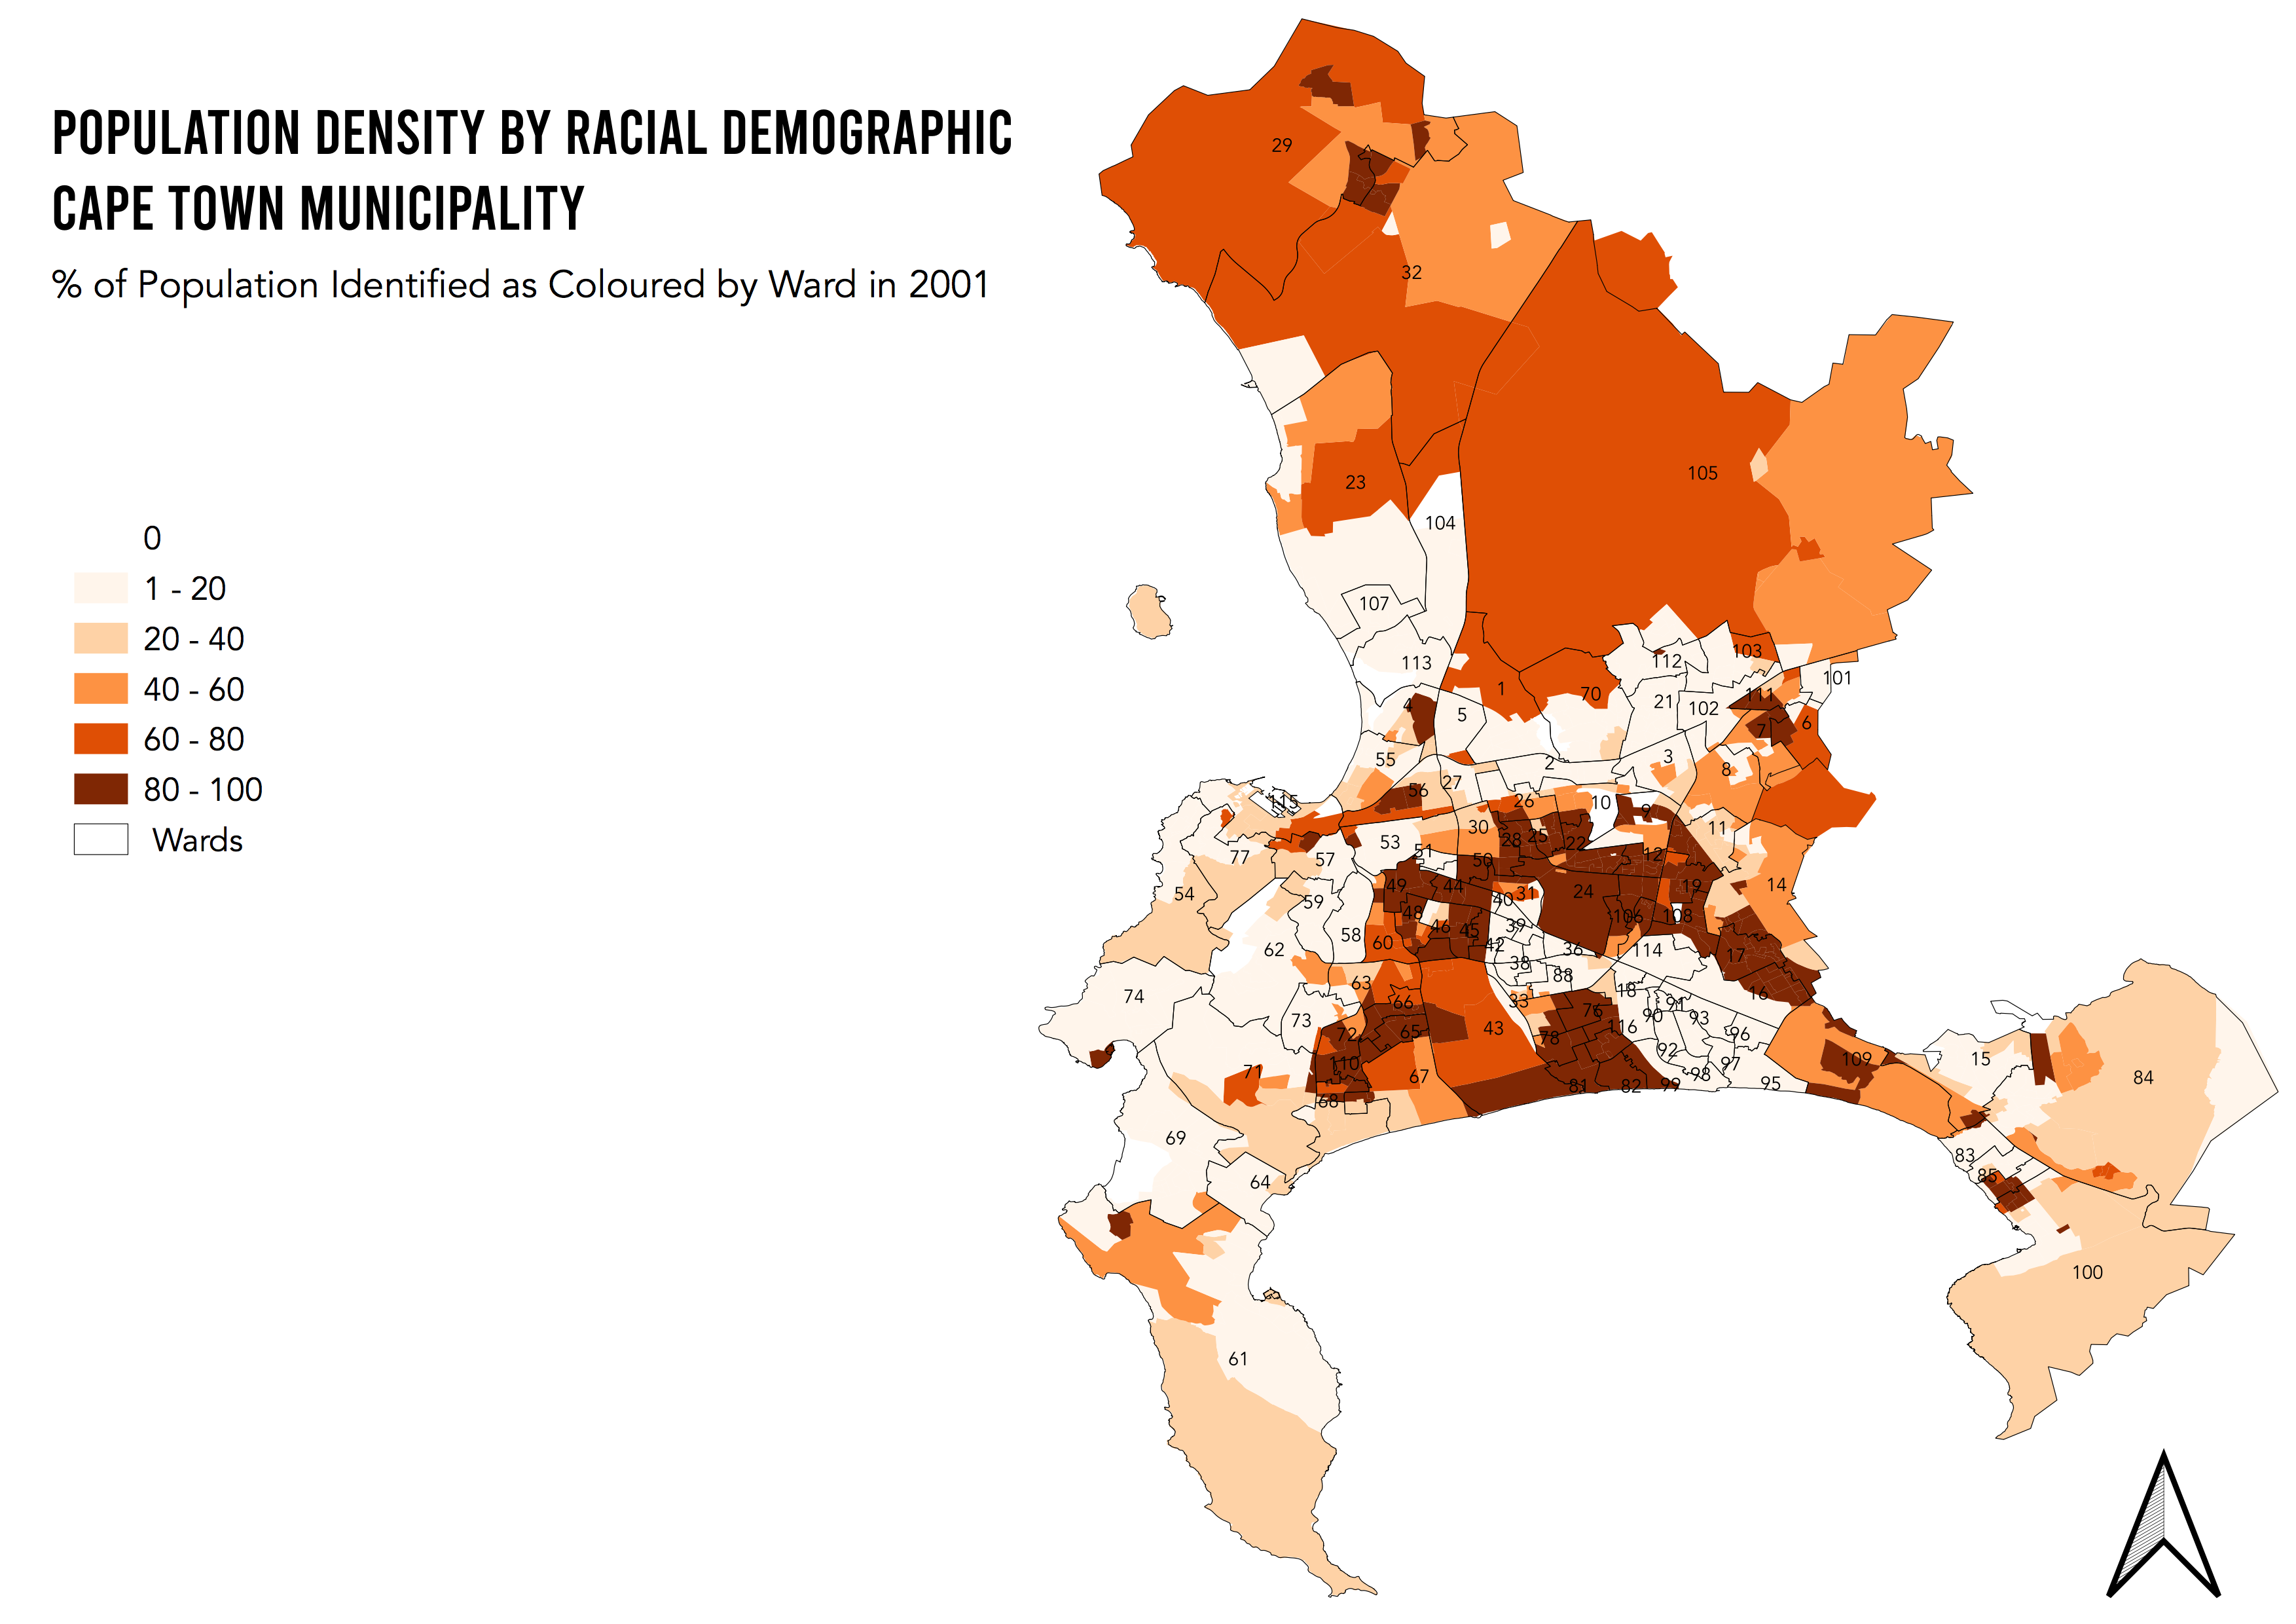
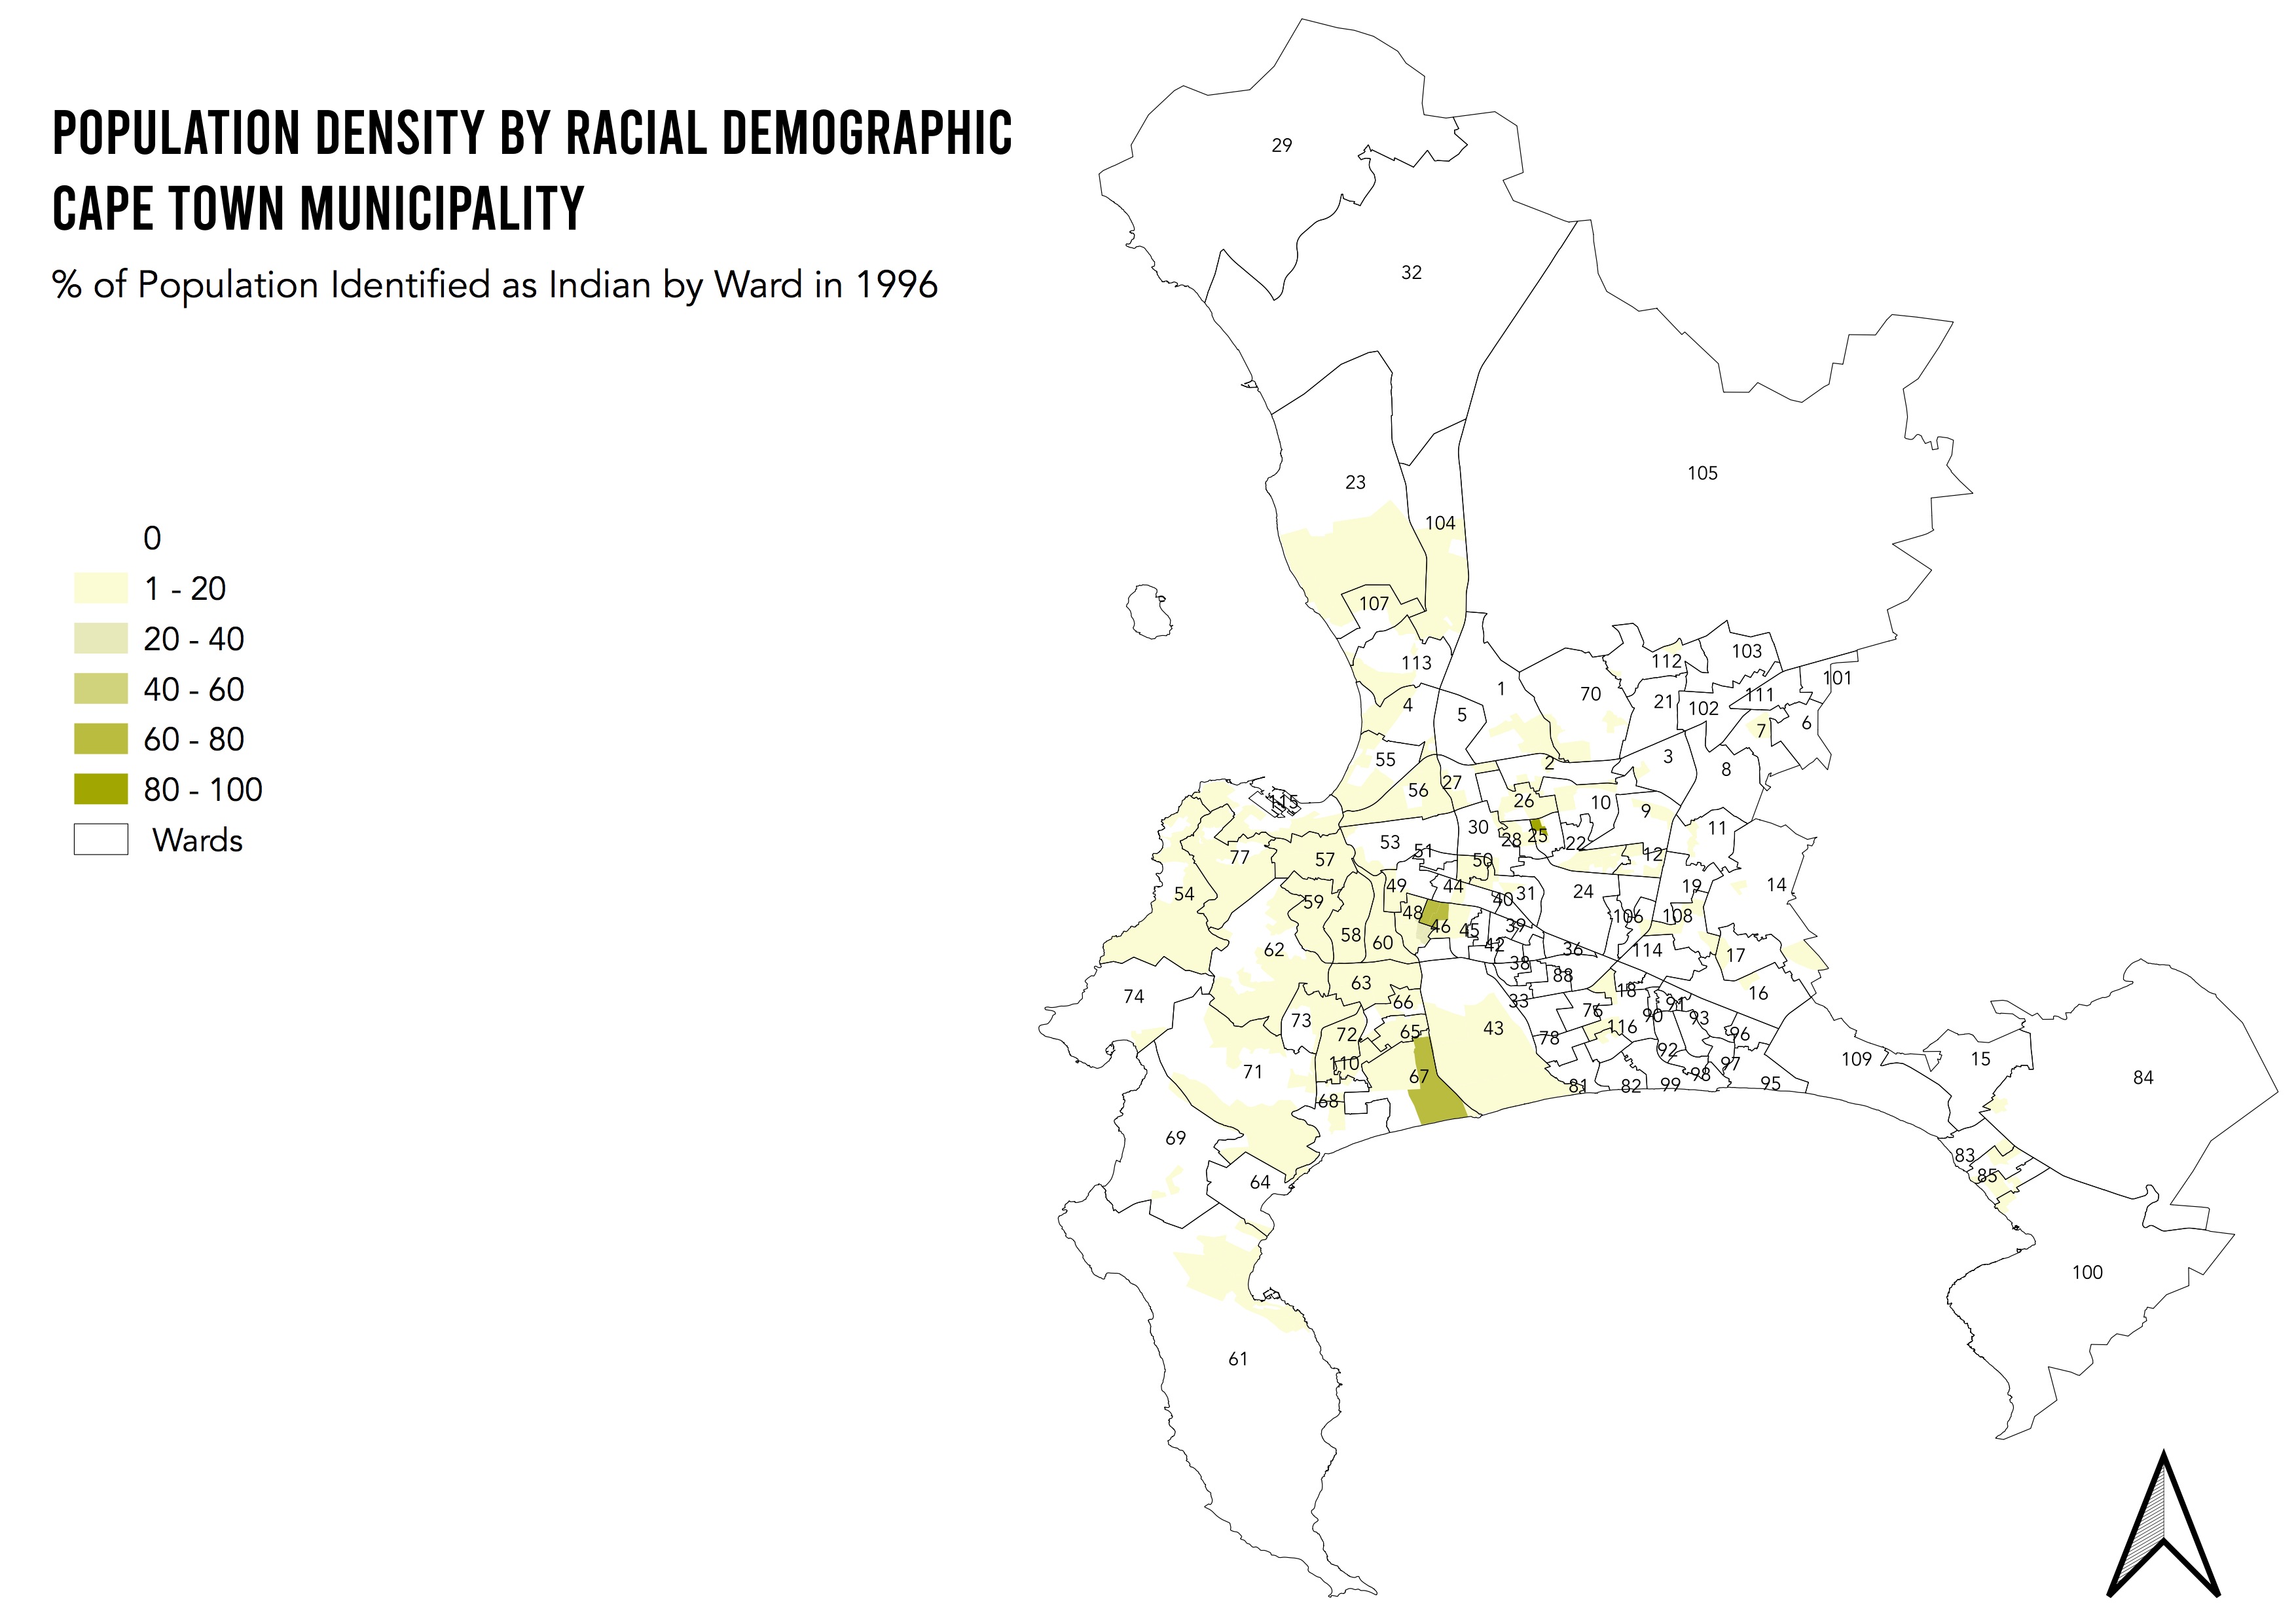
I was then able to upload the data into QGIS and begin visualizing the population density by racial classification. Below I show the density by racial classification in 1996, followed by 2001. The South African population was divided into three main racial groups under apartheid: Whites, Natives (Black Africans), Indians and Coloured (people of mixed race)
% of Population Identified as White by Ward in 1996 & 2001
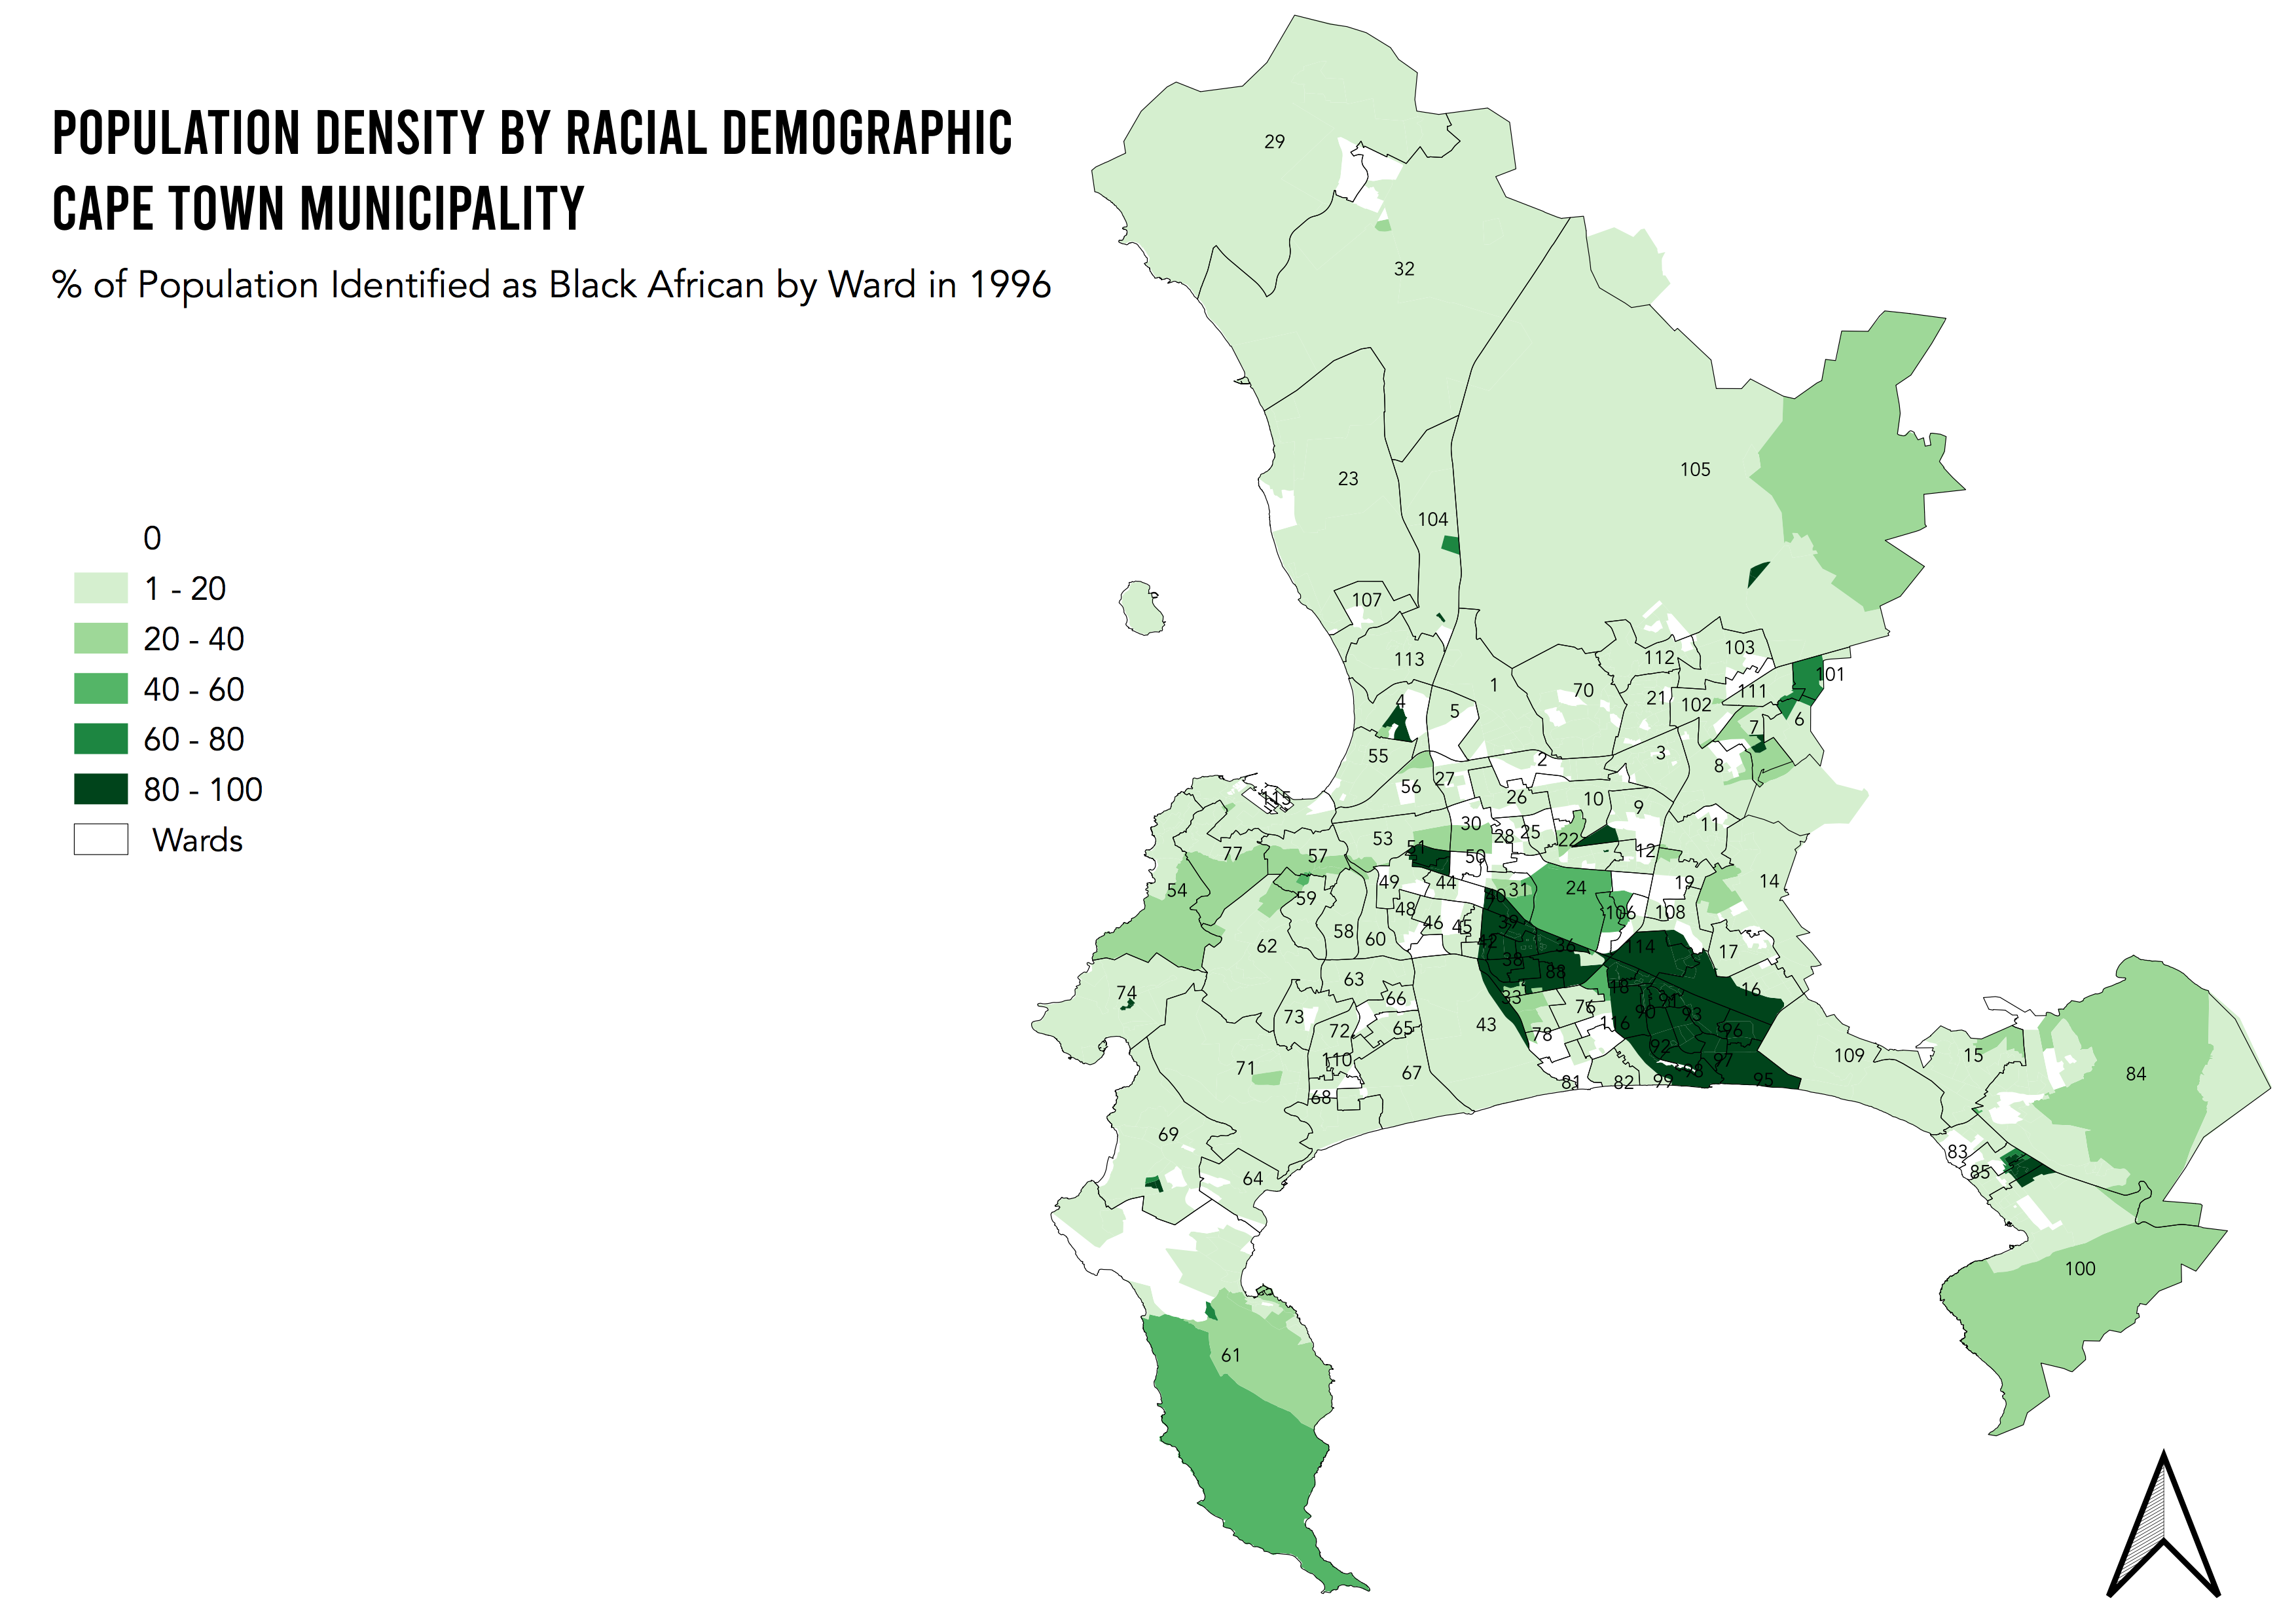
% of Population Identified as Black African by Ward in 1996 & 2001
% of Population Identified as Coloured by Ward in 1996 & 2001
% of Population Identified as Indian by Ward in 1996 & 2001
I then found the increase in % of the population from 2001 - 1996 by racial demographics to see what areas were experiencing increases and if that correlated to the highly densely populated areas by race, in other words, if areas were not becoming less segregated.
I then show the % of the population below-median income in 1996 and 2001, which is the starting point for further investigation into how racial segregation has impacted income inequality.
In taking this project further, it will be important to add the 2011 census data, and to include additional indicators contributing to racial and economic segregation, such as access to education, access to transportation, unemployment rates, and the progress on inclusionary housing, a movement that has gained momentum in South Africa in an attempt to break the cycle of segregation.
Resources:
- Link 1 - thenewschool.carto.com/u/hajoc903/builder/dadb59ef-ef01-4058-8619-edc0d8bcfe70/embed